Growing cycling: EuroVelo Usage Barometer shows strong increase for first part of 2025
The European Cyclists' Federation and Eco-Counter work together since 2020 to gather data about the usage of EuroVelo routes using a sample of automatic bicycle counters installed all across Europe. We monitor data at the beginning of each calendar year and at the end of the summer season to present it at the EuroVelo & Cycling Tourism Conference. The data of the EuroVelo Usage Barometer is part of the EuroVelo Data Hub.
Substantial increase in traffic in the first part of 2025
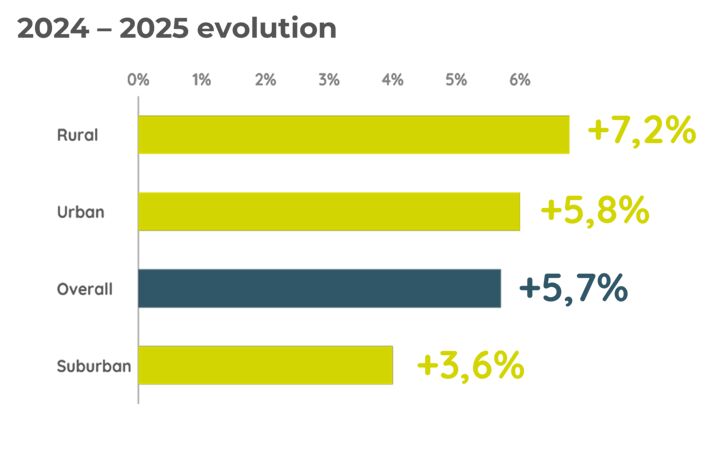
Overall, the representative sample of 519 counters on EuroVelo saw a considerable increase of 5.6% in traffic between January and August 2024 and the same period in 2025. Growth was high both on weekdays (+5.5%) and on weekends (+6.1%), with the slightly higher rate on weekends pointing towards a slightly more dynamic development of leisure cycling. The data for the first eight months of 2025 also provides information on trends in different area types, which we had introduced last year: In 2025 so far, growth has been particularly high in rural areas (+7.2%) compared to urban (+5.8%) and suburban areas (+3.6%). However, traffic in absolute terms remains much higher in urban areas, with an average traffic volume that is 9 times higher at urban than at rural counting sites in 2025 so far.

There are several possible explanations for this trend:
- Meteorological conditions particularly favourable for cycling, namely a dry and sunny spring in large parts of Europe;
- The positive effects of higher investments in cycling infrastructure during the last years and especially since the COVID cycling boom – since there is a lead time for planning and implementing new infrastructure, it is possible that we only start to see the full impact now (+11,600 km of developed EuroVelo routes from 2021 to 2025 according to the 1.pdf EuroVelo Route Development Status Report (2025));
- A trend towards more local leisure and tourism activities by bicycle – this could be driven by concerns for sustainability, but also by financial constraints for households after years of high inflation and low economic growth. Cycling leisure and tourism trips cater to all income levels and offer a high degree of flexibility in terms of spending, from luxurious to budget-conscious.
Several routes see two-digit growth rates
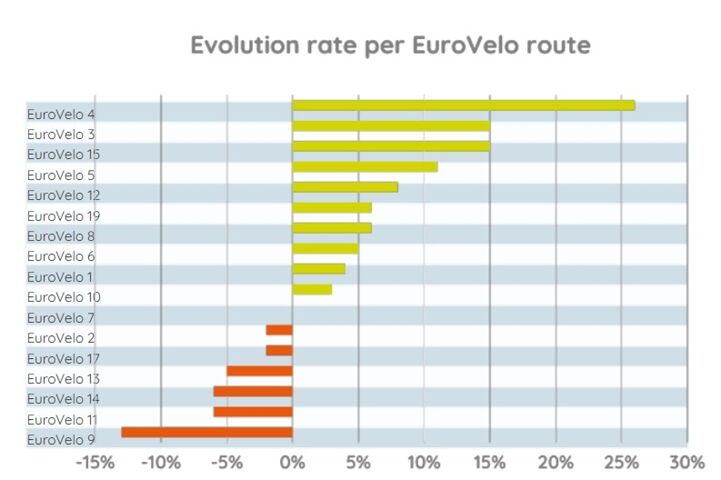
While overall growth of traffic on EuroVelo has been substantial, we see steep differences across routes this year. In total, 10 routes of 18 in the sample showed increases in traffic, one route had largely stable traffic, and 6 routes saw decreases (there were 8 in 2024). The routes with the highest growth rates this year so far are EuroVelo 4 (+26.3%), EuroVelo 3 (+15.1%), and EuroVelo 15 (+14.6%). The variations do not consider volumes and may represent various situations from one route to the other.

Eco-Counter's Robin Ranjore presented these and more data at the EuroVelo & Cycling Tourism Conference 2025.
Methodology
For establishing the analysis of traffic on EuroVelo in 2025, Eco-Counter, which has been providing traffic counting systems since 2000, relied on a set of 519 representative unique counting sites (649 counting points on EuroVelo routes considering route overlaps) throughout the EuroVelo network installed by relevant authorities, most of the time regions and municipalities. Since 2024, the sample has grown substantially compared to previous analyses which were based on 2019 as a reference year (the 2023 report was based on a sample of 195 counters). The sample is still not covering all the EuroVelo network but improves the accuracy of the analysis by including more counters from certain countries (e.g. Austria, Finland, Hungary, Poland, Switzerland, the UK, etc.).
Article by Holger Haubold