France launches a new tool to visualise cycle route traffic data: first figures show sustained growth on route network in 2022
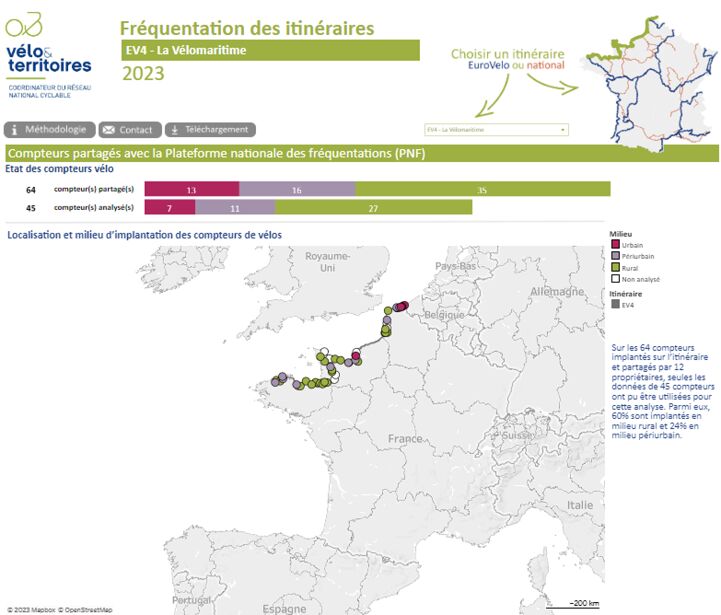
Vélo & Territoires, the French National EuroVelo Coordination Centre, has recently launched a new tool visualising traffic data from national cycling routes, including national sections of EuroVelo. What makes this tool extremely helpful for stakeholders and interesting as an inspiration for other countries: the data is recent (from automatic counters), has been curated (verified and checked for anomalies) and analysed (for example according to size and type of municipalities), and can be downloaded for further analysis. It is based on the existing national usage monitoring platform, managed by Vélo & Territoires since 2012 and compiling data of +1,500 automatic counters from 157 partners in 2022.
The tool currently presents the following data:
- the location of the counters included in the analysis
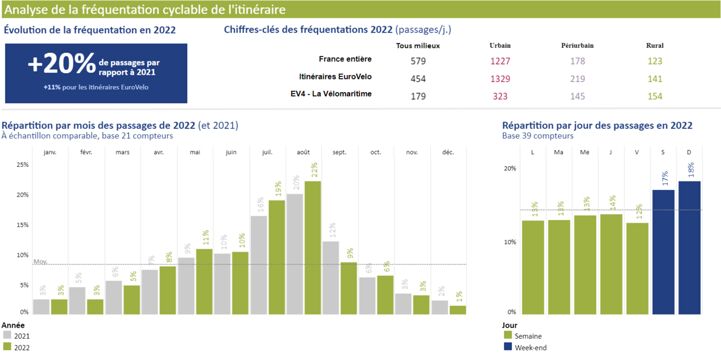
- the average number of users on the route compared with the national level and with cycle routes of the same level (EuroVelo or national routes)
- the change compared with the previous year.

The data shows a continued increase in traffic on major cycle routes in 2022, after an exceptional year 2021. Overall, the counters installed on French EuroVelo routes recorded 11% more traffic than in 2021. For national routes, the increase was 9%. Behind this national average, a regional analysis suggests that effects of climate change already affect cycling practices: The southernmost routes suffered from the hot summer weather (and forest fires in the case of South-Western France). Even though the active seasons are longer, this has not always been enough to compensate for the drop in numbers over the summer. Looking back further, traffic numbers increased by 44% compared to 2018 on EuroVelo routes and 38% on other national routes.

The data used comes from automatic bicycle counters shared with the national usage monitoring platform (Plateforme nationale des fréquentations). It is carefully checked and cleaned by Vélo & Territoires using a standardised methodology (some resources are available in English at the bottom of this page). Abnormal values, due to broken down counters for example, are reconstructed when their duration does not exceed seven days or excluded from the analyses when their duration exceeds seven days. The data obtained is then cross-referenced with other data sources to enrich the analyses. This is particularly the case for the classification of municipalities based on the national classification system. This categorises the location of each counter as rural, peri-urban or urban. This information can often be used to identify different usage trends in different types of environments. In the future, Vélo & Territoires aims to enrich the content with data on route development or cycling friendly service providers.
To ensure representativity, not all routes of the national cycle route network are included in the tool for the moment. Only routes with a sufficient number of counters are analysed. In addition, they must have at least one counter every 50 km on average and have relatively even coverage along the entire route. This means that currently, eight EuroVelo routes (out of ten) and thirteen routes from the national network (out of 49 - excluding EuroVelo) are represented in the tool.
Are you interested in European Usage Monitoring data? Figures for traffic on EuroVelo is available on the EuroVelo Data Hub, based on a partnership between ECF and counter provider Eco-Counter. You can also download the EuroVelo Usage Monitoring Report 2022 here.
Article by Holger Haubold
Cover picture EuroVelo 4, Cancale, France ©CRT Bretagne, P. Torset