EuroVelo websites shatter records with over two million visitors in 2021
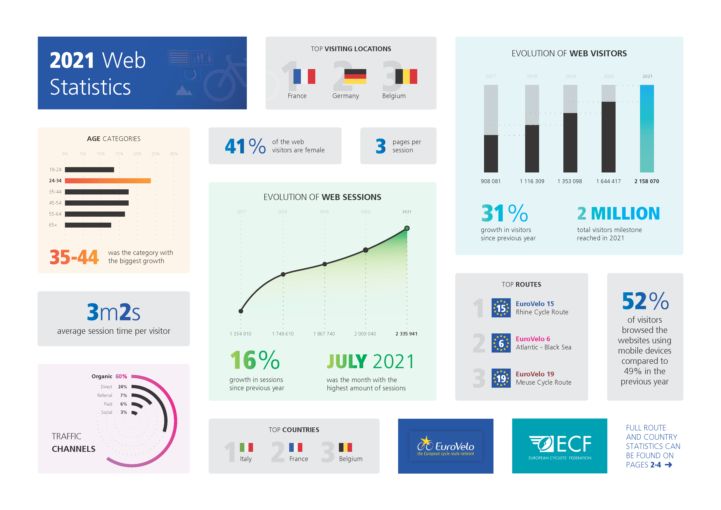
As we start another year of uncertainty in the ongoing pandemic, the continuing popularity of cycling remains a rare positive story. In 2020, the EuroVelo network broke through the two million web sessions1 milestone and last year the entire web platform surpassed the two million visitors2 milestone for the first time. The year-on-year increase of 31% also represents a record high. This constant and significant growth each year further demonstrates that EuroVelo is one of the leading cycling tourism brands in the world.
Download the EuroVelo Web Statistics Report for 2021

Likewise, the figures show a 16% increase in web sessions, more than doubling the growth percentage compared to 2020 and totalling over 2.3 million. There were many success factors that contributed to such growth: modernising the brand; attending Velo-city 2021 in Lisbon; promoting the network in Barcelona with the EuroVelo & Cycling Tourism Conference; further web and network development with our partners; expanding long-term management agreements (LTMAs) to promote routes; running an extended communication campaign under #MoreCyclingTourism, and much much more.
Reaching 100,000 visitors for each top five route
In addition to previous volume metrics, this year’s route rankings now also show the top country and top stage for each route (where applicable). EuroVelo 15 – Rhine Cycle Route remains the most popular in the route rankings, with Germany and Source – Konstanz as the top country and stage pages for the river route. However, other routes such as EuroVelo 8 – Mediterranean Route and EuroVelo 1 – Atlantic Coast Route are rapidly growing in popularity. In fact, the five most popular EuroVelo routes now all have more than 100,000 visitors each. This is the first time this has occurred.
An interesting observation is that four of these routes have active partnerships to further develop and promote them. Such agreements are clearly very beneficial to the success of a route and ECF’s long-term goal is to establish active LTMAs for all EuroVelo routes.
Mobile surpasses desktop and growing female readership
Our past reports had repeatedly commented on the rise of mobile users. Back in 2018, the desktop-to-mobile usage ratio was 55:45 for the website. Three years later, mobile has surpassed desktop with over 52% of all visits to EuroVelo.com happening on smartphones or tablets. While we expect this trend to continue, the speed at which it has happened might slow down in the next few years. However, this remains a significant shift in how people browse our website. In fact, when comparing individually, 16 out of 17 main route pages already have much higher mobile usage. Rest assured, we plan to keep improving the mobile experience in 2022 to make it convenient to access our routes on the go.
In terms of demographics, the fastest growing age category was 34-44 years old. But the 24-34 years old age category remained the most populous. Female readership increased slightly to 41% overall, which puts EuroVelo.com closer to or even above the leading social media platforms in terms of gender balance (source).
First ever country page rankings
Did you know there are 42 countries with at least one EuroVelo route? Each of these have their own dedicated page on our website. So, this year we added a new ranking to show the 20 most popular ones.Italy, France and Belgium come on top. These country pages receive less attention than route pages from visitors, however, the remarkably high growth percentages show that their popularity is increasing. These pages are especially useful to instantly view which EuroVelo routes pass through a specific region and to explore national information, resources, events, and bookable offers in each territory.
If you are more interested in knowing from which country most visitors originate from, then you will find a separate ranking with the top ten visiting locations. Here, France is still the country which brings the most attention to our web platform followed by Germany and Belgium, which moved to third place. The website saw a massive increase from Italian and Dutch visitors as well.
To sum up, last year was yet another stellar performance for the entire EuroVelo web platform. EuroVelo is already established as one of the major cycling tourism successes in the world and this data shows that it is continuing to build on these foundations. Its sustained growth should encourage all stakeholders to keep making it better for all and further investing in cycling and cycling tourism. Moving forward, we hope to be able to consolidate these web statistics with our other data sources to provide a more holistic understanding of the use of the EuroVelo routes over time.
Thank you for your continued support and interest in the EuroVelo network!
Visit the new EuroVelo Data Hub to find aggregated data related to EuroVelo routes through three data sources, including guidance on how to start monitoring cycling tourism and evaluating its economic impacts in your country.
1. Sessions: the period of time a user is active on the site. By default, if a user is inactive for 30 minutes or more, any future activity is attributed to a new session. Users that leave the site and return within 30 minutes are counted as part of the original session. This metric gives an accurate estimate of the number of times visitors opened EuroVelo website(s).
2. Visitors (or users): a visitor to the website(s). Google Analytics keeps track of visitors on the website by automatically creating a user ID. The browser stores this ID as a cookie.